Know Your Tech Terms: Site Performance Analytics

A computer user looking at a computer screen with various site performance analytics

Site performance analytics cover a wide range of indicators. While I cannot cover all of them in this blog post, I will concentrate on a few, namely website traffic, conversions, and bounce rate.

Website traffic concerns the entire volume of people who visit a website. Altogether, “how many people visit a website will depend on the website’s purpose, the visitors’ goals, and the way in which they discovered the site.” Computer servers keep track of website hits, or the number of times a webpage gets visitors. However, a visitor may browse many web pages and take multiple actions. This is known as a session. Understanding website traffic is instrumental in the consistent growth of a website. Organizations can measure their website traffic in multiple ways.

  • Sessions—Organizations observe session numbers over a fixed period to evaluate the effectiveness of traffic-building programs since their implementation.
  • Purchase percentage—E-commerce companies that sell products on their websites depend on website traffic. Essentially, “identifying the number of visitors making a purchase reveals how effective the site is in encouraging people to buy.”
  • Channels—Organizations can measure website traffic through the different channels through which it comes to the website. Channels can include organic search or email.
  • Bounce Rate—Bounce rate documents the number of visitors who leave a website after viewing only one webpage. The lower the bounce rate the better (Airfocus).

Conversions are the actions of website visitors. Actions may include buying a product or signing up for a newsletter (Shiatis). By themselves, conversions offer little context. Instead, companies use key performance indicators (KPIs) to turn conversions into meaningful information. For example, Google Analytics has a Conversions section that allows users to see the KPIs. Conversions use several KPIs, including conversion rate, the total number of conversions, cost per acquisition (CPA), conversion value, and conversion ROI (Kotilla, 2021).

  • The conversion rate is the number of conversions/the number of visitors. For example, if 1,000 users visit the website in January and 120 buy a new product, you have a conversion rate of 12 percent. This “metric matters because the number of visitors to your website is going to go up and down, depending on market conditions, the time of year, and whatever marketing efforts are sending them to the website.” Focusing on the number of conversions alone is not meaningful if it does not consider other factors. Making changes to a website usually involves improving the conversion rate by encouraging more users to convert or increasing a website’s usability (Beasley, 2013, p. 52-53). The conversion rate gauges the performance of landing pages and advertisement campaigns.
  • The total number of conversions is the simplest KPI. It usually involves collecting one or two conversion types over a specific period. Some organizations find it helpful to track conversions by type.
  • The cost per acquisition (CPA) equals the cost per conversion. In other words, how much did an organization pay per conversion? The CPA is determined by the associated marketing costs divided by the number of conversions.
  • Conversion value helps companies estimate the return on investment of conversion rate optimization activities. Usually, organizations estimate the conversion rate except “when the conversion is a purchase, in which case conversion value can be considered equal to the purchase value.” Other scenarios involve how likely a conversion will become a transaction, and what the transaction’s value is. Metrics could involve average deal value or lead-to-customer rate. Sometimes conversion value ties to customer lifetime value and other long-term value metrics.
  • Conversion of ROI is essential to marketing. Organizations need to know the number of conversions, conversion value, and cost per conversion to determine the ROI. The formula for conversion ROI is (Value of conversions – the cost of conversions)/Cost of conversions * 100%.

Conversions also consider sales funnel metrics and revenue. Some conversions never generate sales or the desired outcome. Therefore, organizations must consider how conversions “you capture proceed in the sales funnel, and what are they worth?” Working with the sales department can help determine the average lead-to-customer rate. Successful KPIs can indicate increased overall revenue. When working with KPIs, companies should configure benchmarks for each KPI. With established benchmarks, the company can track conversion performance (Kottila, 2021).

Website traffic and conversion measurements differ from each other in multiple ways. Some companies invest in developing traffic with the expectation that traffic alone drives sales. Other organizations focus so much on conversions by offering top-notch products that they ignore traffic. Without reaching the target audience, an organization limits its potential growth. An organization needs both website traffic and conversions for success. They must balance. Organizations must remember that website traffic gets visibility, but “conversion of that traffic is what gets them sales” (LocalFi).

Business experts state that the bounce rate metric is the “unsung hero of a successful website.” Optimally the bounce rate of a website should be low.

So how could the website decrease its bounce rate? A key tenet of bounce rate improvement is not to allow it to exceed 50 percent. The most common bounce triggers are closing the browser; going to an external link or a link that results in 404 errors; redirecting to a new URL through the address bar; navigating back to the search results and making the page inactive after switching tabs. Experts recommend five ways to decrease the bounce rate.

  • Bounce rates on mobile devices tend to be higher than on desktop computers. Mobile users typically leave a site quickly if any element is out of place or the site is slow to load.
  • Add more visuals. Users prefer sites with images.
  • Since people read differently online, website designers should alter website text accordingly. For instance, experts recommend creating short paragraphs and using bulleted lists.
  • Remove “fluff” material like widgets or promotional elements. Instead, consider putting these elements elsewhere.
  • Use customer testimonials (Rahal, 2021).

References

Airfocus. (n.d.). Website traffic. https://airfocus.com/glossary/what-is-website-traffic/

Beasley, M. (2013). Practical web analytics for user experience: How analytics can help you understand your users [eBook edition]. Morgan Kaufman. https://mbsdirect.vitalsource.com/reader/books/9780124046191/pageid/3

Kottila, S. (2021, March 26). How to measure conversion performance with KPIs. Leadoo. https://leadoo.com/blog/conversion-kpis-how-measure-conversion-performance/#:~:text=Conversion%20rate%20is%20the%20percentage,with%20the%20number%20of%20visitors.&text=This%20central%20KPI%20measures%20the%20performance%20of%20your%20campaigns%20and%20landing%20pages

LocalFi. (n.d.). The two key components to successful marketing: traffic and conversion. https://localfiseo.com/traffic-vs-conversion/

Rahal, A. (2021, June 24). Five ways to reduce your bounce rate. Forbes. https://www.forbes.com/sites/forbescommunicationscouncil/2021/06/24/five-ways-to-reduce-your-bounce-rate/?sh=285f5d731420

Shiatis, C. (n.d.). Website traffic or conversions? Where should I put my efforts? Yello Veedub. https://www.yelloveedub.com/blog/website-traffic-or-conversions

Know Your Tech Terms: SEO Tools

A magnifying glass focusing on the word, "SEO," surrounded by graph elements and a laptop computer

What is an SEO tool? It is any software that developers can use to “improve some aspect of the search engine optimization campaign” (Emley, 2023). With this definition, an SEO tool could help improve a site’s performance by improving security, decreasing loading speed, or better reaching the target audience.

Why use SEO tools? SEO tools save valuable time and provide input. For instance, they help in keyword research and data analysis. They pinpoint what works and what parts could improve on a website. The “best SEO tools also report how you measure up to competitors and where the greatest opportunities lie.” Furthermore, they calculate website performance by language, country, or region (Ferreira, 2022).

Although there are scads of SEO tools available, these are just a few that I previously found useful when I improved the SEO of a nonprofit organization, Christian Growth Resources. Some are free, but others have a paywall.

Wix Website Builder

Wix Website Builder is a Software as a service (SaaS) that can build and analyze a website. I used Wix because the founder of a nonprofit organization built his website based on SaaS and wants to continue to do so. The software’s main page has a dashboard that overviews the site. After creating the website with the software, users can track the site’s analytics, visitors, and traffic sources. The Marketing and SEO portion of the site includes email marketing, Facebook and Instagram Ads, Google Ads, Google Business Profiles, social media marketing, video making, marketing integrations, and logo making. The SEO portion measures site performance (aligned with Google Search Console), and other tools and settings. The software also has promotional features like Wix Multilingual (Wix, 2023).

SEMrush

SEMrush is a marketing SEO tool that allows users to assess search rankings, pinpoint changes, and possible ranking prospects. One essential feature is domain vs. domain analysis, which lets users compare a website with its competitors. For instance, SEMrush allows comparisons of keywords and domains. The analytics reports provide insights into a site’s traffic and search data. The “On-Page SEO Checker tool allows you to easily monitor your rankings and find some recommendations on how to improve your website’s performance.” Organic Traffic Insights puts multiple data points on a dashboard with social share, keywords, and word count (Ferreira, 2022). Currently, the Google Analytics account does not connect with SEMrush, so SEMrush provides different data.

Google Analytics

Google Analytics is a website analytics platform that collects website data to create insightful reports. The founder of the nonprofit organization signed up with Google Analytics and placed a piece of JavaScript code on each webpage. Google Analytics uses this to gather data from the browser. Subsequently, Google Analytics uses the collected data to create reports. The software allows users to use configuration settings to modify data and use filters (Google Analytics Help, 2023).

Lighthouse

Lighthouse is an SEO tool I first learned about in an earlier course. Created by Google, Lighthouse is an open-source, automated tool that audits websites for accessibility, performance, and SEO. To get an overview of a site’s performance, users can enter the URL, and Lighthouse audits the webpage and then creates a report. Web designers can try to rectify any failed audits by making improvements. Every report has a reference document describing each issue’s importance and how to improve it (Chrome Developers, 2022).

Adobe Illustrator

Adobe Illustrator is a vector graphic editor that lets users make, alter, and save vector images. Web designers primarily employ vector images in graphics, logos, and typography, and vector images are highly scalable and maintain quality when scaled up or down. For this project, I created the logo for the website using this program.

Adobe Photoshop

Adobe Photoshop is a raster graphics editor that allows users to create, change, and save raster images. Raster images differ from vector images because their building blocks are grid-like pixels used to create the image. Vector images display a varying array of gradient tones and colors. Raster images have less scalability than vector images and can easily distort. The program has a Save for the Web (Legacy) feature, allowing users to save images in smaller sizes for website usage (Popovic, 2022). 

Sucuri SiteChecker

Sucuri SiteChecker is a file malware scanner I found while researching the security section of the project proposal. It analyzes a website’s code for peculiar HTML or PHP files. Also, it scans for malware. Regularly checking the website for security problems can help identify areas of concern. Rapidly reacting to security threats can safeguard visitors and help sustain organic traffic, SEO rankings, and brand reputation. The site is free (Sucuri, 2022).

References

Chrome Developers. (2022, May 24). Overview. https://developer.chrome.com/docs/lighthouse/overview/

Emley, B. (2023, October 30). The nine best SEO tools in 2024. Zapier. https://zapier.com/blog/best-seo-tools/

Ferreira, N.M. (2022, March 18). Eighteen best SEO tools that SEO experts actually use in 2022. Oberlo. https://www.oberlo.com/blog/seo-tools

Google Analytics Help. (2023). How Google Analytics works. https://support.google.com/analytics/answer/12159447?hl=en

Incorporating Accessibility in a Nonprofit Website: A Case Study

Individuals with disabilities surrounding  the internet symbol on a computer screen

Website accessibility is “designing and developing websites, tools, and technologies so that people with disabilities can access them.”  It matters because it is a legal obligation and helps format website content to be more accessible to crawlers and users. Increased accessibility can result in all users being able to navigate and interact with the site. Assistive technology (AT) depends on code signals that control the context of what search engines crawl. Accessibility covers visual, auditory, physical, speech, cognitive, learning, and neurological disabilities. It helps users read smaller screen sizes and those with slower internet connections. Most accessibility features relate to SEO-related ranking elements—anchor text, ALT text, headings, and page titles (Pawar, 2022).

Evaluating a Website’s Accessibility

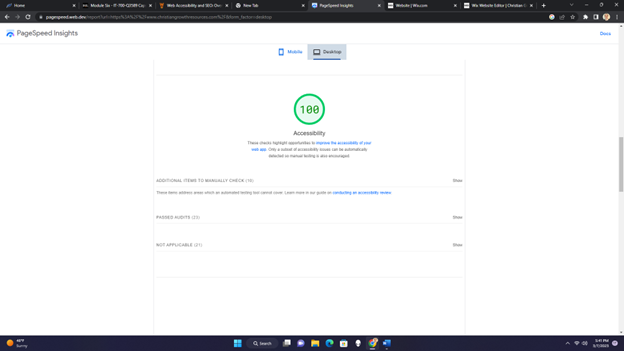
Figure 1

Screenshot of the desktop Accessibility score for the homepage of Christian Growth Resources

An example of an accessibility score for PageSpeed Insights for a desktop homepage with a 100 percent rating

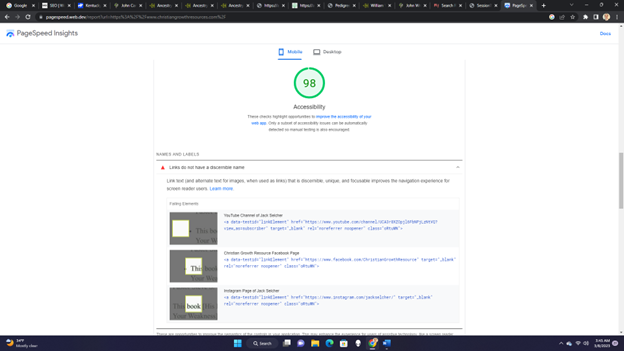
Figure 2

Screenshot of the mobile Accessibility of the homepage of Christian Growth Resources

An example of an accessibility score for PageSpeed Insights for a mobile homepage with a 98 percent rating

I used PageSpeed Insights to determine coverage of accessibility issues of the desktop and mobile homepages of Christian Growth Resources, a nonprofit organization. The founder of the site relies on Wix Website Builder to maintain it.

  • The desktop version of the homepage passed all the Accessibility audits (100 percent score) on PageSpeed Insights, as shown in Figure 1. To help achieve this score, I added alternate text to the social media icons in the desktop version.
  • The mobile version of the homepage scored ninety-eight percent, as shown in Figure 2 (PageSpeed Insights, 2023). This less-than-perfect mobile version score was because the three social media icons in the footer needed link text. However, the Wix Website Builder program at the time did not allow users to set the link text for social media icons in the mobile version, which was a fault in the program.

According to the Worldwide Web Consortium (W3C), accessibility incorporates the following four principles: 

  • Users must have access to information and interface components that offer them methods they can perceive, such as text alternatives for non-text content and contrasting foreground and background.
  • Users must have practical user interface components so that keyboards can operate all functions and websites have operable navigation.
  • Users must have access to an understandable and operable user interface, including readable text content and predictable web page appearance and behavior.
  • Users must have rich content that assistive technology and other user agents can reliably interpret.

Website accessibility often overlaps with website performance. Thus, improving accessibility results in better performance. Search engine guidelines incorporate SEO and performance guidelines to improve user experience, accessibility, and performance, including using headings, incorporating ALT text, selecting descriptive anchor text, creating on-site sitemaps, defining straightforward website navigation, and improving readability.

Including ALT Text

ALT text helps describe images in words for screen readers and when images do not load. Therefore, “the alternate text has to be accurate and relevant to the image and not just many keywords stuffed to help the bots.” ALT text transverses into SEO when 

used for more traffic and click-throughs due to image searches. Christian Growth Resources has ALT text for all images on the website, blog, and social media icons (desktop version only).

Selecting Descriptive Anchor Text

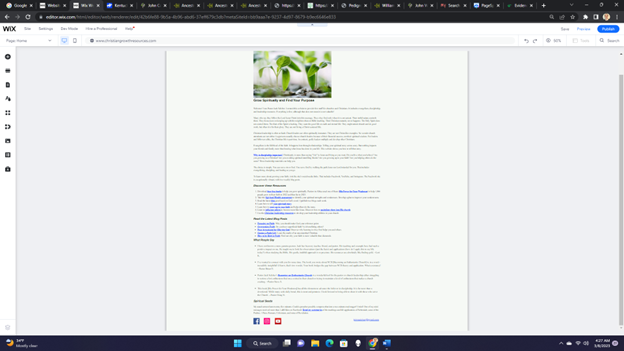
Figure 3

An example of a webpage incorporating anchor text

Screenshot of the Homepage showing Anchor Text

Anchor text is the descriptive text in the content that duplicates as a link. It allows the web designer to incorporate keywords, describe a page’s content that links with it, and detail its purpose. Anchor text allows links to appear naturally in the content instead of an insistent “click here.” It can detail page content with which it links, describe its purpose, and incorporate keywords. Many of the web pages contain anchor text. For example, Figure 3 shows the anchor text on the homepage. I used anchor text to highlight some of the most critical parts of the website.

Headings

Headings “communicate the organization of the content on the page.” In accessibility terms, plugins, assistive technologies, and web browsers can use headings to offer in-page navigation. The initial site audit showed that Christian Growth Resources had no headings. I created styles for six headings (H1-H6). Each page only had one H1 heading—the title of the page. Headings help organize text passages, so in most situations, headings appear in chronological order (W3C, 2023).

Making On-site Sitemaps

Making on-site sitemaps can assist search engine crawlers in accessing a site. The sitemap outlines every file and page on the website and assists users in navigating through the website and locating relevant content. With “web accessibility in mind, the on-site sitemaps help provide an overview and clear navigation to all the pages on the site” (Pawar, 2022). 

Wix Website Builder automatically optimizes the sitemap index to follow best practices, which include individual sitemaps. The program creates individual XML sitemaps automatically for every web page type. An XML sitemap index organizes all the individual sitemaps into a format that search engines can easily crawl. The sitemaps update instantaneously whenever a site change occurs (Wix, 2023).

Defining Clear Website Navigation

A website’s navigation helps users find what they are trying to locate. One design marker that makes a navigation menu easier is if all pages are only a few clicks deep. For instance, according to SEMrush, all the pages on Christian Growth Resources are one or two clicks deep. Also, navigation menus help “search engines and screen readers navigate through your website.” Christian Growth Resources uses a horizontal menu in the desktop version and a hamburger menu style in the mobile version.

Improving Readability and Promoting Visual Clarity

To increase readability, website designers should tailor content to the target audience. Composing the content for the target audience involves including apt headings, prominent keyword usage, and internal and external links. Another content goal is to write simply without complicated jargon. Although I did not write most of the content because the site founder is the subject expert, I did edit all the content with Grammarly to simplify it. According to SEMrush, most pages were not technically challenging; however, three pages were (including the homepage). Some of the difficulty could be due to Biblical-related words, which, although not mainstream, are essential to the content. I used SEMrush’s SEO Writing Assistant to simplify the language and decrease paragraph size. I improved the readability of most of the site’s pages through these methods.

           The content and website elements need visual clarity. 

  • I made all the content left justified (Pawar, 2022).
  • One readability issue I had to fix more than once was the background and foreground colors having a sufficient contrast ratio. First, the font and background colors needed more contrast on some green buttons with off-white font colors. To increase the contrast, I changed the button color to deep brown and the font color to white. Another contrast issue occurred with the desktop version’s horizontal menu. Again, the navigation menu was green with white text. However, since the contrast was insufficient, I changed the font color to black, passing the PageSpeed Insights audit.
  • I chose accessibility fonts to improve readability and contrast. Initially, the website used fonts that were not accessible and had contrast problems, according to PageSpeed Insights. Eventually, I decided on two accessible fonts: Helvetica Bold for the headings and Times New Roman for paragraphs (Site Improve, 2023).
  • Another readability issue is that the document should use legible font sizes. Although the 16px Times New Roman font for the paragraphs of the desktop version was not an issue, the same font was a problem in the mobile version. I increased the mobile version’s font size to 19px, which passed PageSpeed Insights.
  • Furthermore, I needed help with the size of tap targets in the mobile version. Specifically, the social media icons were too small for users to click. Based on the guidelines provided by PageSpeed Insights, I resized the social media icons to the appropriate size of 48px by 48px (PageSpeed Insights, 2023).

I explained how I integrated accessibility into a nonprofit website. Using PageSpeed Insights as a measuring stick, I adapted various website elements to meet accessibility standards. I included alternate text, anchor text, on-site sitemaps, straightforward navigation, well-defined visual elements, and simpler content. Some issues I addressed include improperly sized tap targets, inappropriately sized fonts, insufficient contrast between the foreground and background colors, and a need for link text in the mobile version.

References

PageSpeed Insights. (2023). The mobile version of christiangrowthresources.com. https://pagespeed.web.dev/report?url=https%3A%2F%2Fwww.christiangrowthresources.com%2F

Pawar, S. (2022, May 12). Web accessibility and SEO: A beginner’s guide. WP Rocket. https://wp-rocket.me/blog/web-accessibility-seo/

Site Improve. (2023). How to choose a font for accessibility. https://www.siteimprove.com/glossary/accessible-fonts/#:~:text=The%20most%20accessible%20fonts%20are,rather%20than%20the%20body%20text

W3C. (2023). Headings. Design and Develop. https://www.w3.org/WAI/tutorials/page-structure/headings/

Wix. (2023). Sitemaps. https://manage.wix.com/dashboard/bb9aaa7e-9237-4d97-8679-b9ec6646e833/seo-home/sitemap?referralInfo=seo-home

Summary of the Schema.org Meta Implementation Process and Its Importance    

A sign with "Schema.org" surrounded by confetti on a wooden table

Schema.org is a dictionary of property definitions, enumerated values, and types (Schema.org, 2022b). It provides various vocabularies that web designers can employ to markup webpages in a way that major search engines can understand (Schema.org, 2022a). This code clarifies information provided to search engines so they can better understand your website’s content. As a result, this “helps provide users with better, more accurate information in the rich snippets that are displayed beneath the page title” (Smith, 2019). Web designers use these Schema.org definitions with the JSON-LD, RDFa, or Microdata formats to append data to web content (Schema.org, 2022a). Examples of the schema include product/service, company profile, social media profiles, website URL, phone number, rating/review, and news articles that appear because of specific search queries.

Using schema on a website does not require website designers to learn another coding language, but it does involve following a series of steps. Website designers can use various tools to add the schema to a webpage. In total, there are two ways to generate schema. First, you can use a schema markup generator to create your schema markup. Generators include Google Data Highlighter, Google Structured Data Markup Helper, and JSON-LD Schema Generator by Merkle. The other way to generate schema is through plugins on WordPress websites. Finally, website designers can test their schema through validators and test tools like Yandex Structured Data Markup, Google Rich Results Tester, and Bing Webmaster Tools Markup Validator.

How do you use a schema markup generator? To show you how to generate schema, I went step-by-step through one of the schema generators, Google Structured Data Markup Helper.

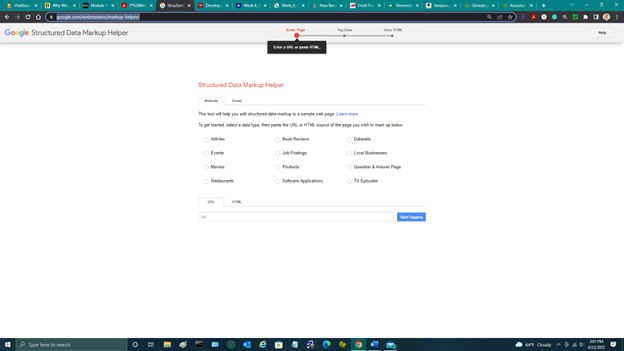
  1. Go to Google Structured Data Markup Helper. This tool helps you add structured data markup to a sample webpage. Your screen should appear like the enter page screenshot in Figure 1.

Figure 1

Screenshot of Entering Page with Google’s Structured Data Markup Helper

A screenshot of the opening page for Google’s Structured Data Markup Helper
  •  Choose the data type you intend to markup. The first image shows the data types you can select from including articles, events, movies, restaurants, book reviews, job postings, products, software applications, datasets, local businesses, question-and-answer pages, and TV episodes.
  • Paste the website’s URL or HTML code you intend to markup at the bottom of the page.

Figure 2

Screenshot of Tagging Data with the Google Structured Data Markup Helper

A screenshot showing how to tag data with Google Structured Data Markup Helper
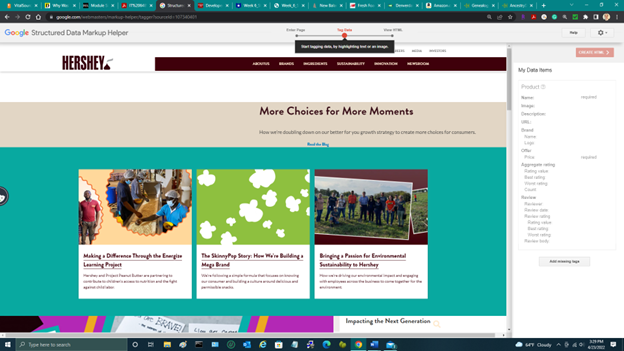
  • Figure 2 shows the tag data section of Google’s Structured Data Markup Helper. You can start adding tagging data by highlighting an image or text.

Figure 3

Screenshot of added Product Data Item 1

Screenshot showing an added data item
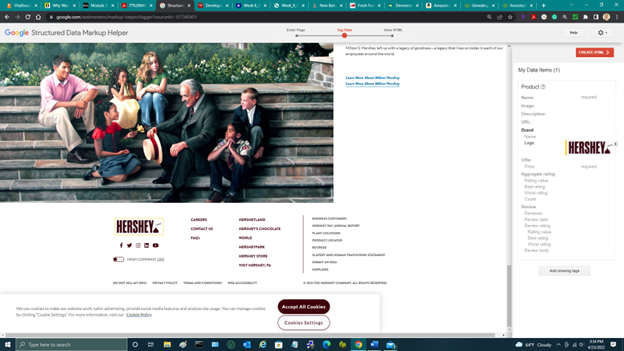
  • Continue adding data items by selecting different images or text. Figure 3 shows the first data I included, a logo image under Brand. Use the data item list to guide you as you highlight different page elements. You do not need to emphasize every item on the page—just the necessary ones. Typically, the more data items you add, the better.
  • Then create HTML.
  • You can “use the Structured Data Testing Tool to find out what your page will look like with the added markup.” Additionally, you can use the tool to evaluate for different warnings.
  • Next, add the generated schema markup to the webpage. This step also allows you to include the generated schema markup before testing.

How Metadata Insertions Allow Ranking Organization

One of the reasons why implementing schema markup is so important is it provides search results with a schema that allows the user to find the right webpage quickly. This information helps “your website rank better for all kinds of content types, get found, and in turn, get more clicks.” Although users should pay attention to every detail found on search engine results pages, most do not (Smith, 2019). Metadata forms a majority of SERPs. Every search result in a SERP has two different sections: meta-titles (or title tags) and meta-descriptions (or snippets). Metadata provides the first impression search engine users get of your website. Therefore, ensure the metadata on your web pages is relevant, optimized, and unique.

Metadata directly impacts how each webpage ranks within a search engine. One factor in page rankings is the click-through rate (CRT). The CRT signifies how often each webpage appears in search results compared with the frequency search engine users click on and visit each webpage. The higher the CRT, the higher the likelihood that the webpage will rank higher in the search results standings. Thus, “for this reason, optimizing your metadata ends up becoming an indirect but very important factor in your overall SEO efforts” (Jozwiak, 2020). In effect, websites can get a thirty percent increase in click-through rate with a properly implemented schema (Smith, 2019).

Another way metadata plays a role in search engine ranking is through chosen keywords. Metadata should include high-level keywords because the keywords will appear in bold in the meta-description. This setup draws more attention than a less optimized search result (Jozwiak, 2020).

References

Jozwiak, S. (2020, October 27). Best practices for understanding and writing metadata. https://denverdata.com/blog/metadata-best-practices

Schema.org. (2022a, March 17). Getting started with schema.org using microdata. https://schema.org/docs/gs.html

Schema.org. (2022b, March 17). How we work. https://schema.org/docs/howwework.html

Smith, M. (2019, January 29). What is schema markup and how to add it to boost SEO. Impact Learning Center. https://www.impactplus.com/blog/what-is-schema-markup-and-how-to-implement-it

User Analysis and Usability Testing Make Your Site Roar

A  user on a stone-cobbled path marked with a "User Analysis" sign in a landscape filled with dinosaurs

In the movie, Jurassic Park, John Hammond, the head of InGen, invites many people, including subject matter experts and his grandchildren, to tour the park for the first time. Up to this point, the park has been so top secret that many of the company’s shareholders do not know what they are investing in. Because of an accident in the park at the beginning of the movie, the investors demand an investigation into the park’s safety. This corresponds to when website design goes wrong for unknown reasons, web designers often conduct a user analysis.

  • For instance, user analysis “reveals user behaviors and preferences that aren’t otherwise measured.” Once the visitors go on the park’s tour, the audience witnesses the behaviors of actual park visitors or users. If anything, their behavior does not go according to plan. Visitors exit the electric tour cars while they move, deride the ride because they hardly see any dinosaurs on the dinosaur tour, and eventually abandon the tour cars altogether. InGen and Hammond predicted none of these reactions. Similarly, user analysis might produce some unpredictable results. Therefore, it is important to document all user behaviors.
  • User analysis measures what motivates people to come to your website. In Jurassic Park, we learn the subject matter experts come because of incentives (funds for research) and the kids go because they are part of the target audience. Understanding why your users visit your website will increase the chance they stay awhile.
  • Furthermore, user analysis pinpoints the barriers that stop people from converting. Although Hammond and InGen did some user analysis before selecting the park’s first visitors, Hammond and InGen did not completely understand them. For example, InGen found that subject matter experts like Dr. Ian Malcolm and Dr. Alan Grant, chosen because of their areas of expertise, would not endorse the park because they thought it was ethically wrong. As Malcolm memorably said, “Your scientists were so preoccupied with whether or not they could, they didn’t stop to think if they should.” InGen soon found that ethics (messing with nature, playing God) was a significant barrier. Although on a smaller scale, a website with substantial problems could prevent conversions. User analysis helps you find these problems.
  • User analysis finds the “hooks that persuade users to convert.” Jurassic Park had many bells and whistles (the Brontosauruses, the T-Rex, the Raptors). Initially, the sight of live dinosaurs stuns visitors. In this way, InGen understood how to lure people to Jurassic Park. However, they could not make them want to stay. Likewise, user analysis helps explain user behaviors when visiting websites so organizations can get visitors to stay longer.

Usability testing is a “way to evaluate the functionality of a website by observing real users as they attempt to complete tasks.” In the movie, the visitors evaluate the dinosaur tour. Each tour car has a camera that allows the InGen staff to observe the visitors’ actions. The task the visitors are trying to complete is the first Jurassic Park tour. Usability testing helps reveal design flaws, especially ones that are blind to the designers. One overlooked issue in Jurassic Park is that the tour cars did not have locks. Everyone left their still-moving electric tour cars and perused the grounds. Doing multiple usability test types gives a company a better chance of finding glitches, bugs, and misleading wording. Usability testing in Jurassic Park would show that the dinosaur tour could not work. The insurmountable problems (escaping dinosaurs, infrastructure issues, hubris, sheer stupidity) meant something wrong was bound to happen. Usability testing can pinpoint the glitches that website designers miss (Hotjar, 2022).

References

Hotjar. (2022, February 2). Five user-driven website analysis methods. https://www.hotjar.com/website-analysis/user-analysis/